“Advertisements for shipping to Prince Rupert in British Columbia tout ‘infrastructure solutions’ at the ‘congestion-free’ port,” reports an L.A. Times article headlined with the words “L.A., Long Beach ports losing to rivals amid struggle with giant ships”.
Big Ships Big Problems
Ports probably feel like the Notorious B.I.G. when he sang “Mo Money Mo Problems”.
Of course the chorus for the ports would sing, “It’s like the more TEUs we come across, the more problems we see.”
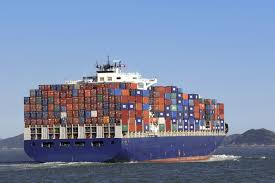 Big ships create big problems for ports. For the Ports of Los Angeles and Long Beach, big ships have been a big factor in losing market share.
When megaships first started hitting the water, it seemed like the Ports of Los Angeles and Long Beach had a competitive edge as most ports in the Americas couldn’t receive these mammoth ships.
There was excitement back in 2012 when megaship, The Fabiola shattered previous size records when it called on the Port of Long Beach. The Fabiola, 30 feet shorter in length than the Empire State Building is tall, is now one of the smaller megaships out on the water.
Container ships are now much, much bigger than they used to be.
“The average container ship being built now is nearly three times the size of the average a decade ago,” says the L.A. Times article by Chris Kirkham and Andrew Khouri quoted above.
Carriers moving to these huge ships accounts for one of three international shipping buzzwords causing major problems for ports and costing the Ports of Los Angeles and Long Beach market share.
The buzzwords are: Megaships, Alliances, and Congestion.
That L.A. Times article highlights how megaships and alliances work together to create congestion:
To fill enormous ships, ocean carriers are also making agreements to share vessels and pool cargo to save money. Sixteen shipping companies operating in four major corporate alliances now control about 80% of the world’s container shipping fleet, according to industry analyst Alphaliner.
That consolidation has caused immense headaches at port terminals, where longshoremen must sort through containers from multiple carriers before they can be fetched for truckers waiting to pick them up.
Of course now ports all over the world, and the country, are scrambling with infrastructure projects to catch up to and handle the increase in ship sizes.
Other Factors Costing Los Angeles & Long Beach Market Share
While the L.A. Times article focuses on the megaships and alliances as the problems causing congestion, there were other factors causing congestion at the Ports of Los Angeles and Long Beach. The biggest of these other factors was a lack of chassis available to move containers out of terminals at the ports.
Then came labor slowdowns from the International Longshore & Warehouse Union (ILWU) and mini-lockouts in response from the Pacific Maritime Association (PMA) during contentious contract negotiations for dockworkers on the West Coast.
Shippers lost confidence in West Coast ports as imports didn’t get delivered in time to hit the shelves for holiday shopping and agricultural exports rotted on the docks. Of course, many shippers had already lost confidence in West Coast ports like those of Los Angeles and Long Beach when the ports were shutdown by a lockout during the 2002 labor contract negotiations.
“The [Los Angeles and Long Beach] ports handled 39% of U.S. container imports in 2002; that fell to 32% by 2013, according to U.S. census data,” reported the L.A. Times article.
Market Share Percentage Shifts from 2014 to 2015
Datamyne’s free report “Ports & Carriers Ranking January-April 2015 vs. January-April 2014” shows clearly how the Ports of Los Angeles and Long Beach lost market share over the last year in the fallout from the congestion and ILWU contract negotiations:
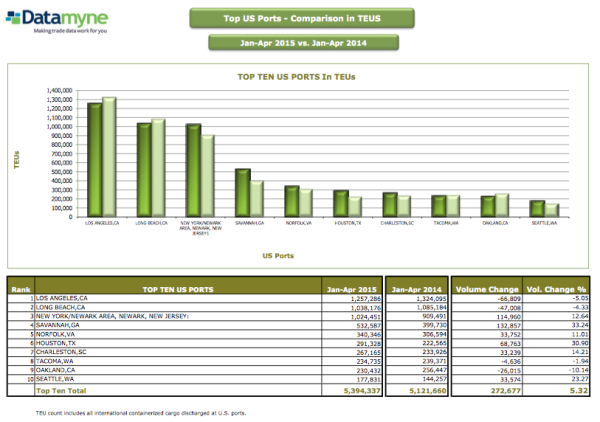
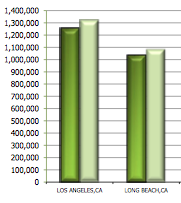 The dark green bars show the TEUs of cargo discharged at ports from the January through April months of 2015 and the light green bars show the TEUs from the same period in 2014.
While Los Angeles and Long Beach total TEUs dropped, East Coast ports handled more TEUs in a period when there was overall growth in TEUs of cargo shipped.
A 5.05% drop in cargo volume for the Port of Los Angeles made its market share drop from 22.21% during this period in 2014 to a 20.02% market share for the period in 2015. The Port of Long Beach experienced a 4.33% drop in cargo volume resulting in its market share going from 18.20% to 16.53%.
The only ports on the West Coast that managed to increase their volume during this time of overall volume growth were the Ports of Seattle and Port Hueneme. Seattle had a 23.27% volume increase that resulted in its market share going from 2.42% to 2.83%. Hueneme’s 4.24% growth in volume was enough to maintain its 0.30% of the market share.
East Coast ports are the ones that really saw market share gains. The Ports of New York/New Jersey had a 12.6% gain in volume causing it to almost catch the Port of Long Beach in terms of market share. This period in 2014, New York/New Jersey had 15.26% market share; in 2015 the market share jumped to 16.31%, just 0.05% smaller than Long Beach’s market share.
Savannah’s 33.24% volume increase jumped its market share from 6.71% to 8.48%.
“When you are No. 1 in the nation, everybody’s going to come after you,” Gene Seroka, executive director of the Port of Los Angeles was quoted as saying in the L.A. Times article.
They’re not just coming after you, Ports of Los Angeles and Long Beach; they’re succeeding. And don’t forget about the ports from outside the country, like Prince Rupert in British Columbia, that are also going after your market share.