International Shipping Industry Overview Part 2
The nerdy overview of the international shipping industry continues. To be fair, this is an overview that looks at ocean freight shipping with an emphasis on Trans-Pacific trade.
In Part 1 of our International Shipping Industry Overview, we covered the increasing size of containerships, idle ships, and ship scrapping.
Today we get into the money topics a little bit.
Capacity in TP Trade
Okay, we’re starting off with one of those pesky acronyms. TP Trade stands for Trans-Pacific Trade.
Importing from China is just one of the many, many types of international shipping deals we handle. However, it is one of our most popular route services, making TP Trade a hot topic for many of our customers. TP Trade would also includes other locations in Asia than China for both importing from and exporting to.
Note: Universal Cargo Management can handle all your TP international shipping needs as well as your import and export shipments to and from just about every location around the world.
Alphaliner provided a capacity survey that gives a good picture of what the major carriers’ capacity looks like over the last couple years and how it has changed in terms of TEU.
The weekly capacity on the FE-North American route had a year-on-year increase of 7.9%, reaching 403,000 TEU in August.
The carriers with big contributions to this significant capacity are APL, HMM, MOL, EMC, CSCL and UASC. But as you can see, most carriers added capacity over this time period.
| AUG 2013 vs 2012 | |||
| Weekly TEU | Aug-13 | Aug-12 | |
| Maersk | 36,400 | 35,900 | 2% |
| Evergreen | 33,800 | 29,300 | 15% |
| Hanjin | 33,200 | 31,200 | 6% |
| COSCO | 31,800 | 30,600 | 4% |
| APL | 31,500 | 24,300 | 30% |
| MSC | 27,300 | 27,700 | -1% |
| Hapag-Lloyd | 25,600 | 24,900 | 3% |
| CMA CGM | 24,300 | 22,800 | 7% |
| HMM | 20,300 | 17,500 | 16% |
| Yang Ming | 19,900 | 19,400 | 3% |
| K Line | 19,800 | 18,800 | 5% |
| MOL | 19,200 | 17,200 | 12% |
| NYK | 18,500 | 17,000 | 9% |
| OOCL | 17,700 | 18,400 | -4% |
| CSCL | 17,100 | 14,700 | 16% |
| ZIM | 11,500 | 13,100 | -12% |
| UASC | 4,900 | 1,400 | 249% |
| Wan Hai | 4,400 | 3,400 | 30% |
| PIL | 3,200 | 3,300 | -2% |
| Mason | 2,700 | 2,700 | 0% |
| TOTAL | 403,100 | 373,600 | 7.9% |
(Source: Alphaliner issue 34)
The reason capacity is so important as we get into money issues of international shipping, is that it’s a huge factor in freight rate pricing.
In 2011, overcapacity created great freight rates for shippers and helped cause losses in the billions for carriers.
What’s Happening with the GRI and PSS?
Carriers struggle to manage capacity growth on the transpacific route. As alluded to above, an inability to manage the TP capacity growth has led to rate weakness.
For the carriers it is rate weakness, for shippers it is an opportunity for exporting and importing between Asia and the U.S. at favorable costs.
Carriers have made several attempts to push rates to higher numbers using GRIs and the old PSS.
Note: (GRI = General Rate Increase. After the serious losses carriers experienced in 2011, they imposed a large number of GRIs in 2012. It felt like I was blogging about the next GRI to hit every week. PSS = Peak Season Surcharge. With a focus on GRIs and the peak season showing drops, even becoming harder to lock down, the PSS seems to be losing the emphasis it has traditionally held.)
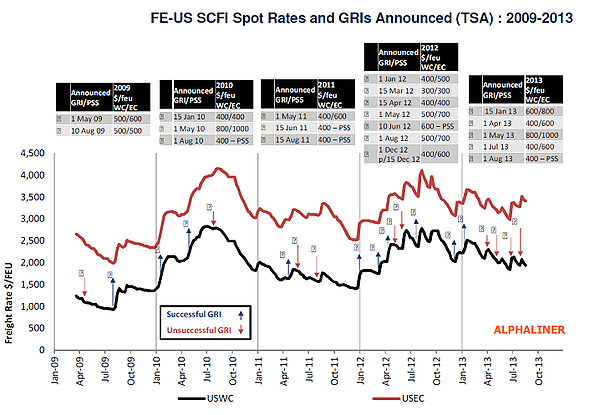
Carriers’ use of the GRI/PSS has yielded some short term effects, especially in 2012. But what Jerry Huang, Director of Ocean Freight Procurement Asia for Toll Global Forwarding/Seamaster Global Forwarding points out in reference to the below chart from Alphaliner is that the GRI/PSS have largely ended without fruitful results, especially for U.S. West Coast.
 To see Alphaliner’s newsletter on this, click here.
The spot rate for US West Coast fell to numbers on August 16th that were 28% lower than at the same time last year.
From the beginning of August, the TSA guideline PSS of $400 was supposed to be in effect, but spot rates still fell below their July levels as carriers kept postponing their implementation of the PSS.
Market Rates Post September 01 GRI
Now we’re at September and carriers are working to raise rates with GRIs.
Positive economic signals from the US for the second half of 2013 helped them in being able to bring in GRIs with some confidence.
The utilization of vessel capacity for East Coast ranges from percentages in the high 90’s to nearly full. This is accompanied with a strong outlook that filling vessels nearly to capacity should last deep into the Peak Season.
Because of the capacity utilization just mentioned, East Coast rates should make the GRI that was just implemented on September 1st sustainable for carriers.
Things are less favorable for carriers on the West Coast, though, with ship loading factors relatively weaker. There, the range of capacity utilization falls more in the high 80’s to low 90’s percentile range. This year has never actually seen the West Coast capacity fully utilized.
That significant TP capacity growth talked about above being a large factor in all this.
So overcapacity makes it unclear as to how well carriers will be able to implement and maintain GRIs on the Transpacific. While you can expect Transatlantic GRIs to continue to come in such as the October 1st GRI Maersk has announced there.
All the same, we here at Universal Cargo Management will continue in our diligence to get you the best freight rate pricing we can and maintain our extremely high levels of customer service for your imports and exports.

![]()
Source: China